

History, latency and uptime
Open a check and select a seven- or 30-day history view. Use location/resolver results to investigate a particular source rather than relying only on totals.
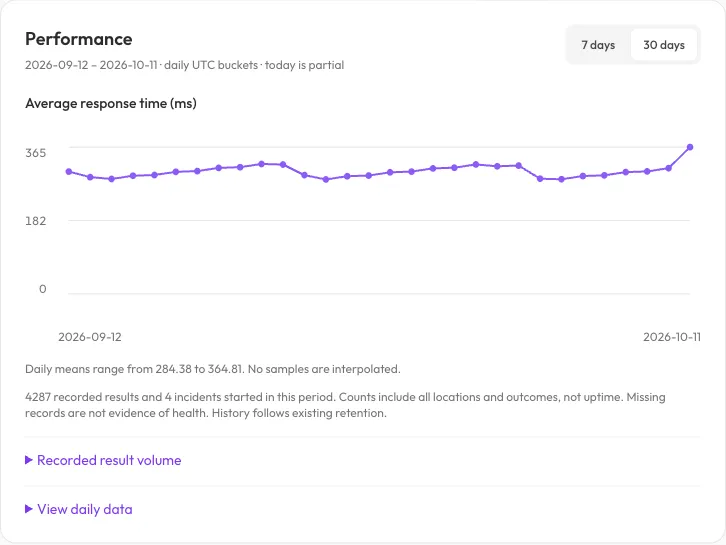
The demo chart shows daily average response times, not an uptime graph. Its recorded-result and incident counts describe activity in the selected window.
| Measure | What it tells you | What it does not tell you |
|---|---|---|
| Run count | Recorded activity in the selected window | That every expected run happened |
| Mean latency | Average of recorded durations | Availability or browser load speed |
| p50 / p95 | Distribution of available durations | Missing runs or guaranteed latency |
| Incident count | Incident starts in a daily history bucket | Every incident overlapping the bucket |
| Uptime | Fraction of the window without an open incident | Independently verified success at every instant |
Daily automation history and latency use UTC calendar-day windows; uptime uses a rolling seven/30-day window clipped to check creation. An incident overlapping a window contributes downtime even if it began before the window. Overlapping downtime is not counted twice.
Degraded and down time both count as not up. Historical paused/pending intervals are not available for reconstruction, so incident-free percentage must not be presented as verified uptime during those periods.
Missing durations are null, not zero milliseconds. Heartbeats and expiration
lookups do not fabricate network latency. Retention and a newly created check
can limit available samples; inspect the returned window and retention metadata.
See API diagnostics for fields, filters and precise window semantics. Use current results and timestamps together: unchanged health can reflect an inconclusive or infrastructure-suspect sample.